Boiling Points and Densities in Cryogenic Gas
Understanding the boiling points and densities of industrial gases such as oxygen, nitrogen, and argon is crucial for various applications in cryogenics, gas production, and transportation. These properties influence how gases are stored, handled, and used under varying pressure conditions. This article delves into these gases’ boiling points and densities at different pressures, providing valuable insights for industry professionals.
Boiling Points and Densities: What You Need to Know
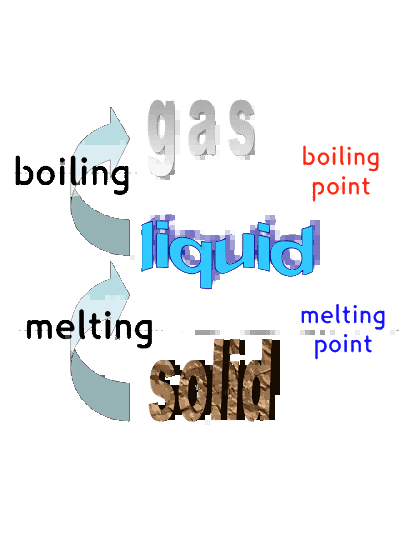
The boiling point is the temperature at which a liquid transitions to vapour, while density refers to the mass per unit volume of a substance. For cryogenic gases like oxygen, nitrogen, and argon, these properties fluctuate with pressure changes, making them critical for designing and operating storage and transportation systems.
For example, liquid oxygen, used extensively in healthcare and industry, must remain below its boiling point of approximately -297°F (at atmospheric pressure) to stay in liquid form. As pressure increases within a cryogenic tank, the boiling point rises, requiring precise insulation and pressure control to maintain the low temperatures needed for safe storage.
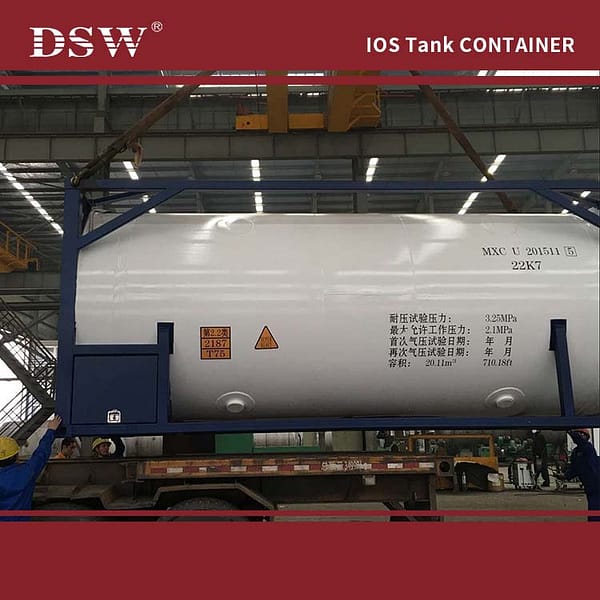
Density data is equally vital. When transporting liquid nitrogen in ISO tanks, knowing its density at specific pressures (e.g., 50.5 lb/ft³ at 0 psig) allows for accurate volume calculations, ensuring efficient use of storage space while avoiding over-pressurization or evaporation losses.
Understanding these properties is not merely theoretical—it has real-world applications. For instance, hospitals rely on liquid oxygen for respiratory therapies, and the food industry uses liquid nitrogen for flash-freezing. Even minor deviations in boiling point or density can cause inefficiencies, material losses, or safety hazards. By leveraging this knowledge, industries can optimize operations, minimize risks, and ensure high-quality outcomes.
The Science Behind Boiling Points and Densities
Boiling points and densities are directly influenced by pressure and temperature. As pressure increases, the boiling point rises because more energy is required for molecules to escape the liquid phase. Conversely, at lower pressures, the boiling point decreases.
Similarly, density changes with pressure and temperature. At higher pressures, molecules are compressed, leading to greater density. In contrast, higher temperatures cause the molecules to expand, reducing density. These principles are essential for predicting and controlling the behavior of cryogenic gases in storage and transport applications, ensuring their efficient and safe handling.

Boiling Point Chart
| Pressure (psig) | Oxygen (Density lb/ft³, Boiling Point °F) | Nitrogen (Density lb/ft³, Boiling Point °F) | Argon (Density lb/ft³, Boiling Point °F) |
| 0 | 71.2, -297 | 50.5, -321 | 87.7, -303 |
| 10 | 69.6, -288 | 48.9, -312 | 85.4, -293 |
| 20 | 68.5, -281 | 47.8, -306 | 83.7, -286 |
| 30 | 67.5, -275 | 47.0, -301 | 82.4, -281 |
| 40 | 66.6, -271 | 46.2, -297 | 81.2, -276 |
| 50 | 65.9, -267 | 45.6, -293 | 80.2, -272 |
| 60 | 65.2, -263 | 45.0, -290 | 79.2, -269 |
| 70 | 64.5, -260 | 44.4, -287 | 78.4, -265 |
| 80 | 63.9, -257 | 43.9, -284 | 77.6, -262 |
| 90 | 63.4, -254 | 43.4, -282 | 76.8, -259 |
| 100 | 62.8, -251 | 42.9, -279 | 76.1, -257 |
| 110 | 62.3, -249 | 42.4, -277 | 75.4, -254 |
| 120 | 61.8, -247 | 42.0, -275 | 74.8, -252 |
| 130 | 61.3, -244 | 41.5, -273 | 74.2, -250 |
| 140 | 60.9, -242 | 41.1, -271 | 73.6, -248 |
| 150 | 60.4, -240 | 40.7, -269 | 73.0, -246 |
| 160 | 60.0, -238 | 40.3, -268 | 72.4, -244 |
| 170 | 59.5, -237 | 39.9, -266 | 71.8, -242 |
| 180 | 59.1, -235 | 39.5, -264 | 71.3, -240 |
| 190 | 58.7, -233 | 39.1, -263 | 70.8, -239 |
| 200 | 58.3, -232 | 38.7, -261 | 70.3, -237 |
| 210 | 57.9, -230 | 38.4, -260 | 69.7, -235 |
| 220 | 57.5, -228 | 38.0, -259 | 69.2, -234 |
| 230 | 57.1, -227 | 37.6, -257 | 68.7, -232 |
| 240 | 56.7, -226 | 37.2, -256 | 68.3, -231 |
| 250 | 56.3, -224 | 36.9, -255 | 67.8, -230 |
Practical Applications
The knowledge of boiling points and densities is essential for various practical applications:
Healthcare: Liquid oxygen is stored and transported for medical use in hospitals, ensuring a steady supply of high-purity oxygen.
Food Preservation: Liquid nitrogen’s extremely low boiling point makes it ideal for rapid freezing and long-term storage of perishable goods.
Aerospace: Liquid argon and nitrogen are used in advanced cooling systems for spacecraft and satellites.
Semiconductors: Liquid argon is a critical component in the plasma etching process, ensuring precision in microchip manufacturing.
These gases’ unique boiling points and densities also influence the design of cryogenic tanks, pumps, and vaporizers.
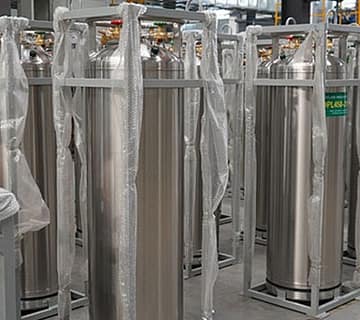
Data on boiling points and densities are critical for designing and operating equipment that stores or transports these gases. For instance, cryogenic tanks must maintain the gases at specific temperatures and pressures to keep them in a liquid state. Knowing the boiling points helps set these parameters accurately, ensuring safety and efficiency.
Visualizing the Data
Consider using graphical representations to make the data more accessible. A pressure vs. boiling point graph can show how the boiling point of each gas decreases with increasing pressure. Similarly, a bar chart can illustrate the density variations at different pressures.
Summary
Oxygen Boiling point: ranges from -297°F at 0 psig to -224°F at 250 psig, decreasing density from 71.2 lb/ft³ to 56.3 lb/ft³.
Nitrogen Boiling point: ranges from -321°F at 0 psig to -255°F at 250 psig, decreasing density from 50.5 lb/ft³ to 36.9 lb/ft³.
Argon Boiling point: ranges from -303°F at 0 psig to -230°F at 250 psig, decreasing density from 87.7 lb/ft³ to 67.8 lb/ft³.
Conclusion
Understanding the boiling points and densities of oxygen, nitrogen, and argon at various pressures is essential for their efficient and safe use in industrial applications. These properties influence the design and operation of storage and transportation systems, ensuring that gases are handled correctly to maintain their liquid state.
References
Reference: Property Data from sources like the National Institute of Standards and Technology (NIST).






No comment